Home > UBIQUITI NETWORKS > UBIQUITI NETWORKS 2.4GHz Air Router User Guide
UBIQUITI NETWORKS 2.4GHz Air Router User Guide


AirRouter User Guide
Chapter 3: AirOS™
Preferences In this section you can modify AirView
Settings, such as enabling or disabling charts, or
specifying the frequency interval.
Note: Java Runtime Environment 1.6 (or above) is
required to use the Airview tool.
Main View
Preferences
Charts
Device Displays the device name, MAC and IP Address of
the device running AirView.
Total RF Frames Displays the total number of RF frames
gathered for as long as AirView has been running or since
the “Reset All Data” button was pressed.
FPS Indicates the total number of frames gathered per
second. The wider the interval amplitude, the fewer frames
per second will be gathered.
Reset All Data Press this button to reset all gathered data.
Use this function when you want to analyze the spectrum
for another place or address.
Enable Top Chart Select the chart to be displayed in the
top chart on the main view. There are two options:
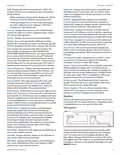
• Waterfall This is a time-based graph showing the
aggregate energy collected over time for each
frequency while AirView has been running. The color of
energy designates its amplitude. Colder colors stand for
lower energy levels (with blue representing the lowest
levels) at that frequency bin, whereas warmer colors
(like yellow, orange or red) mean higher energy levels at
that frequency bin.
The Waterfall View’s legend (top-right corner) provides a
numerical guide associating the various colors to power
levels (dBm). The low end of that legend (left) is always
adjusted to the calculated noise floor, and the high end
(right) is set to the highest detected power level since
the start of the session.
View
Enable Chart Panel 1 (top) Enable this option to display
the top chart, Waterfall or Channel Usage, depending
on which you have selected in Preferences. These are
time-based graphs showing the aggregate energy
collected or Channel Usage over time for each frequency
for as long as AirView has been running.
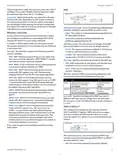
• Channel Usage In this graph, each 2.4GHz Wi-Fi
channel is represented by a bar displaying a percentage
showing the relative “crowdedness” of that specific
channel. This percentage is calculated by analyzing both
the popularity and the strength of RF energy in that
channel since the start of an AirView session.
Enable Chart Panel 2 (middle) Enable this option to
display the middle chart, Waveform. This a time-based
graph showing the aggregate energy collected for each
frequency over time. The color of the energy designates
its amplitude: colder colors stand for lower energy
levels (with blue representing the lowest levels) at that
frequency bin, whereas warmer colors (like yellow, orange
or red) mean higher energy levels at that frequency bin.
Enable Waveform chart (middle) Like the Waterfall
chart, this a time-based graph showing the aggregate
energy collected for each frequency over time while
AirView has been running. The color of the energy
designates its amplitude: colder colors stand for lower
energy levels (with blue representing the lowest levels)
at that frequency bin, whereas warmer colors (like
yellow, orange or red) mean higher energy levels at that
frequency bin.
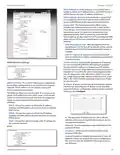
Enable Chart Panel 3 (bottom) When enabled, this graph
displays a traditional Spectrum Analyzer in which energy
(in dBm) is shown in real-time as a function of frequency.
The spectral view over time will essentially display the
steady-state RF energy signature of a given environment.
Clear All Markers Press to reset all previously assigned
markers. Markers are assigned by clicking a point, which
corresponds with a frequency, on the third chart.
Enable Real-time chart (bottom) This graph displays a
traditional Spectrum Analyzer in which energy (in dBm)
is shown in real time as a function of frequency. There are
three traces in this view:
Ubiquiti Networks, Inc.
32
| General | Details |
|---|---|
| Name | UBIQUITI NETWORKS 2.4GHz Air Router User Guide |
| Make | UBIQUITI NETWORKS |
| Language | English |
| Filetype | PDF (Download) |
| File size | 5.15 MB |

If you have any questions regarding UBIQUITI NETWORKS 2.4GHz Air Router User Guide, please ask here and describe the problem in detail.

UBIQUITI NETWORKS ER-12 10 Port Gigabit Router User Guide


NIRAD Networks N200-I-SDWAN-EDGE EDGE Router Installation Guide

ExpressVPN AXG1800 Wi-Fi 6 VPN Router User Manual

hitron CHITA3.1 CHITA-RES Cable Modem Router User Guide
SIERRA WIRELESS AirLink LX40 Enterprise LTE Router User Guide

GL iNet GL-X3000NR 5G NR WiFi 6 Router User Guide

Cudy LT500-OUTDOOR Outdoor 4G Cat 4 AC1200 Wi-Fi Router Installation Guide

DrayTek Vigor2763 Series VDSL2 Security Router User Guide

EXPERT4HOUSE 4G Professional Router User Manual

LTC 1221 4G Wireless Router Installation Guide

Cudy LT500 Outdoor Router Installation Guide